
April 30, 2011
Death Imitates Art

P.S. Barack Obama's favorite movie actually is The Godfather.
—Jonathan Schwarz
April 27, 2011
Spade Actually Heart, Says Keller
By: John Caruso
Here's New York Times editor Bill Keller's latest rationalization for why torture isn't torture when the U.S. does it:
Q. The article today says the documents "are largely silent about the use of the harsh interrogation tactics at Guantánamo." Why does The New York Times continue to refuse to call torture by its name? — Aaron Dome, Chicago
A. Some of the interrogation methods may fit a legal or common-sense definition of torture. Others may not. To refer to the whole range of practices as "torture" would be simply polemical. — Bill Keller
That bit about "some of the interrogation methods" is a new one; apparently the Times is incapable of mentioning "torture" unless it occurs in perfect isolation from any other tactic? So as long as U.S. interrogators ask one polite question, they can pull out the thumbscrews the rest of the time? Man, all these rules!
Fortunately the rules are much simpler and the word is no longer "simply polemical" when it's being used to characterize the actions of designated enemies:
The BBC report adds to testimony from Libyan opponents of the Qaddafi government as well as refugees fleeing the country that Libyan security forces have routinely tortured those in their custody.
And it's also perfectly acceptable when describing the excruciating pain of being forced to sip wine for 30 minutes as your friends carry out over-elaborate food presentation, as in a recent Diner's Journal article titled "Our Friends Torture Us with Fancy Plating" (I'm sure we can all sympathize). Though in fairness, "Our Friends Inflict Harsh Tactics On Us with Fancy Plating" really doesn't scan that well.
I realize some people may criticize Keller and the Times for this, but I for one appreciate them providing us with such a simple and reliable way of determining that they're still boot-licking stenographers of power, since the day I see a Times article that actually calls recent U.S. actions "torture" is the day I'll have to consider subjecting myself to the pain of reading their articles in full (though I'm guessing my bigger concern will be how to dodge all the flying pigs).
— John Caruso
April 26, 2011
April 25, 2011
A Piece Without So Much Math In It
By: Aaron Datesman
I realize that recent posts have had a lot of math in them, and are confusing. Unfortunately, this is unavoidable. The story is rather remarkable, and I'd like for it to be clear why you should believe it. This post, then, is a recap without so many mathy parts. Let's concentrate on the story instead.
The initial lesson, using radioactive Schwarzium, demonstrated that the half-life of an unstable nucleus represents a probability rather than a promise. When you have only four atoms of a radioactive substance, it's actually quite likely (6%) that all four of them will decay in one half-life. The decay process is statistical - and we all know how statistics never lie.
Next, as an aside, we took a moment to ask: how many atoms are there? We are generally given information about activity, in Curies or Becquerels or decays per second (those last two are the same, incidentally). The answer is, a reasonably low rate of 1 decay per second probably corresponds to hundreds of thousands or millions of atoms, all of which could decay at any time.
Then we learned the statistical rule which governs the decay of small numbers of unstable nuclei, and saw that it depends upon the average number of decays occurring in the sample. The rule gives the probability of encountering a number of decays N in the sample when the average number of decays one observes is another number, Nbar. It is physically possible to see 10,000 decays/sec when the average rate is only 5 decays/sec - although it's so unlikely that it's probably never happened in the entire history of the universe.
Finally, in the post before this one we made the commonsense observation that the decay of the unstable nucleus of a potassium atom in your big toe probably can't give you brain cancer. The insight here is that the decay of a nucleus affects only a limited volume around the site of the decay. (Well, for alpha decay, the volume is very small - around 0.0001 cubic millimeters. For beta decay, the volume is about 1 cubic millimeter; and for gamma decay, in many instances the interaction volume should rightly be the whole body.)
Therefore, if you're not a mathy guy or girl, the one piece of supporting information to take away from the previous post is that we should adjust the average rate of decay to reflect the proper size scale.
As an example, our bodies contain a background level of disintegrations of Potassium-40: about 40,000 every second. Potassium-40 is a beta emitter, so those 40,000 decays/sec should properly be spread out over a large number (around 70 million) of independent cubes 1mm on a side. This results in an average decay rate in each cube of around 0.001 decays/sec - which is a quite low rate.
Based upon that simple observation, we then applied the proper statistics, and found that very high decay rates (for short times) occur reasonably frequently even though the average decay rates are very low. Maybe this is surprising, but it's no different than flipping a coin one billion times and discovering that there was one series where it came up tails 74 times in a row.
It's a reasonable suspicion that a cell might not be capable of correctly repairing the damage from a large number of near-simultaneous decays in its vicinity. Therefore, this little oddity of statistical physics could have truly enormous health implications.
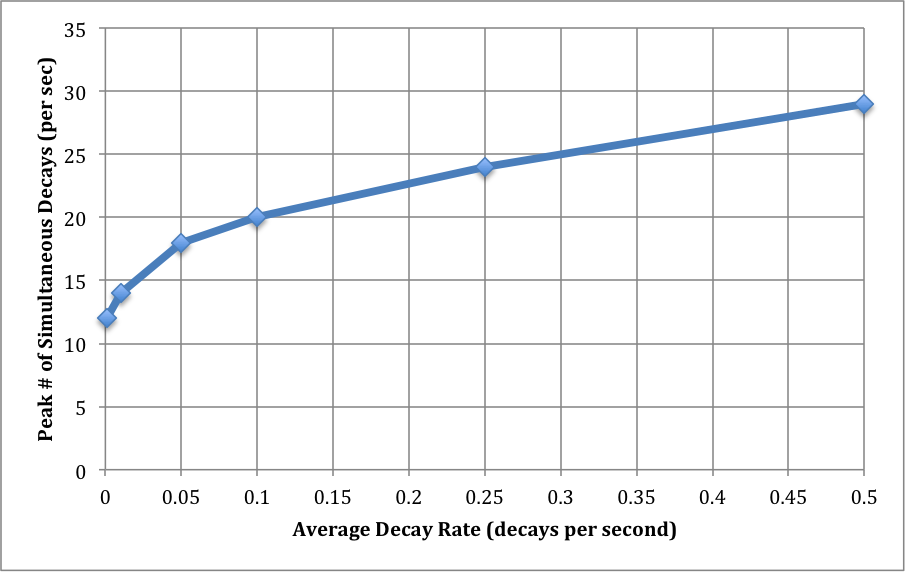
The scale of the concern is shown in the graph below.
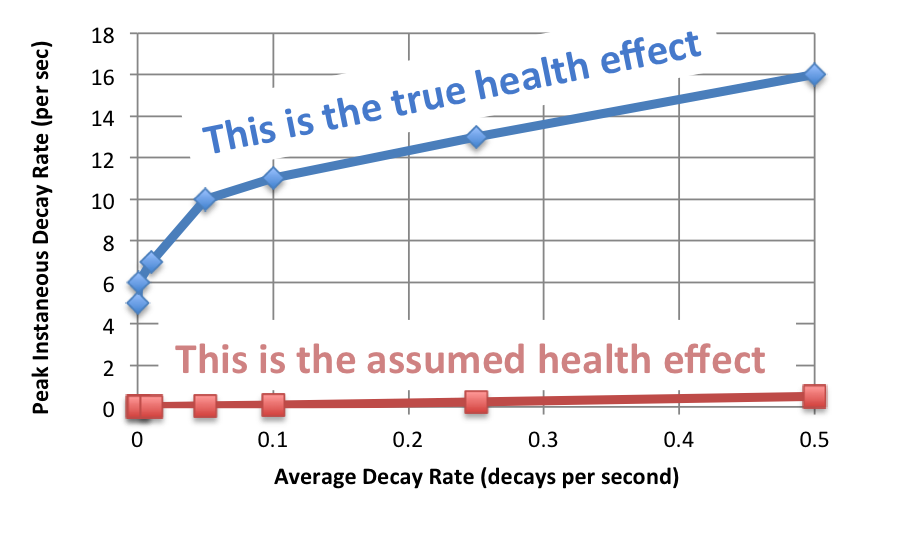
Sorry about all that math. (The numbers are different in this graph from those in the graph in the other post because I corrected an error and removed a factor accounting for the US population. There is no qualitative difference.)
I have a great deal more to say, but am leaving to go on a loooooong vacation which I very richly deserve. I have really appreciated the readers and comments; thanks!
— Aaron Datesman
Seriously, Don't Stop Eating Those Bananas.....
By: Aaron Datesman
I have many problems with the Linear Dose Model, some of which I have discussed before. For the last several posts, I have been teasing apart one of the less-obvious problems: the model ignores statistical effects which absolutely must come into play at low dose rates.
Interestingly, the assumption of linearity is at the root of this problem. The model assumes that 50 individual interactions separated in time by minutes, hours, or even years have the same effect on the cell and on the organism as would 50 interactions occurring all at once. Although this is absurd, I suspect that the authors of the BEIR VII report find it "computationally convenient".
Because I think this is a hard topic to understand, I'm going to explain it using an accurate but ridiculous comparison. You are driving a rocket-powered automobile on the Pennsylvania Turnpike. It's a fantastic vehicle, of course - very fast! - but since it's rocket-powered, it's licensed by the state, and monitored rather closely. If you are caught exceeding the speed limit, the cops will take away your rocket.
This is a dangerous situation for you because your entry time is stamped on your turnpike ticket. If you arrive at a turnpike exit 130 miles from where you entered in less than two hours, you obviously exceeded the speed limit at some point. Therefore, you make the sensible choice to make the whole trip at 500mph, but spend two hours reading apocalyptic Christian literature sold to you by Methodists at the Somerset rest stop.
Of course, you blew past the speed limit by nearly a factor of ten; but your average speed was less than 65 mph. So, you get to keep the rocket ship. The situation with average dose and local dose is pretty much the same.
To be specific, apparently the human body typically enjoys 40,000 decays of radioactive Potassium-40 per second. This is naturally occurring, just part of living, and won't even go away if you build yourself a lead-lined bunker with filtered water and industrial air scrubbers. So, in evaluating whether statistical effects are important and should be considered, let's ask whether than level of activity is ever exceeded by 5%. Will we commonly see 42,000 decays per second?
You can apply Gaussian statistics (Poisson statistics generalize to the easier-to-use Gaussian for large numbers of decays) to calculate, quite straightforwardly, that the probability of this 5% excursion from the average is around 2 x 10^-9. That's a pretty small number. In a year, among a population of 300 million human beings, it will almost certainly occur; but not very often.
And it's a small excursion. Compare 5% to the thought experiment with 4 atoms of deadly Schwarzium, where there was a 1/16th chance that we would obtain double the number of expected decays. In radioactive decay, as in wealth, there is a degree of certainty in large numbers.
So, why am I prattling on about statistics? A factor of 5% is scarcely anything to worry over. The answer, in short, is that we just assumed that the decay of an unstable potassium atom in your big toe can give you brain cancer.
Alpha, beta, and gamma particles are fundamentally different things; they interact with matter in different ways, and have distinct biological effects. For the purposes of this post, however, it's sufficient to note that they possess different ranges in tissue. For instance, beta particles emitted by the decay of Potassium-40 dissipate all of their energy over a distance of around 1mm from the point of emission. The possible biological effects of the decay are limited approximately to that region, and should not be averaged over the entire body.
To put this concisely, the "interaction volume" for beta emission is around 1 cubic millimeter. We should be benchmarking the decay rate against this volume, and not at all against the volume of the entire body. Since the human body has a volume of around 70 million mm^3, it is appropriate to discuss the decay rate as 40,000/70,000,000 = 6x10^-4 decays/sec over 70 million interaction volumes. It is not appropriate to discuss it as 40,000 decays over 1 human body.
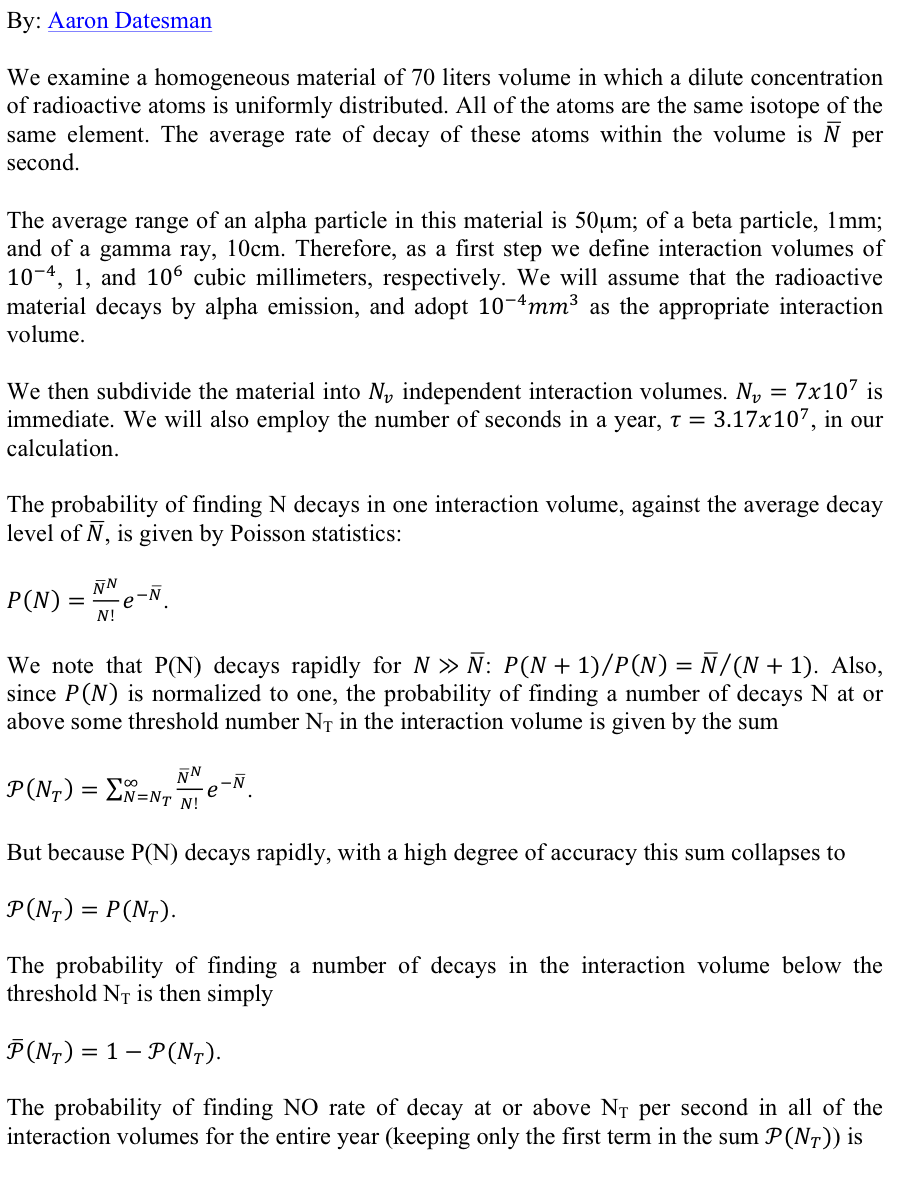
6x10^-4/sec is a low rate of average decay per interaction volume, for which statistical effects absolutely must be considered. So, I went ahead and, using Poisson statistics, did some considering. The graph below shows the probability of seeing multiple decays in an interaction volume for a range of low values of the average rate of decay. (Note that the vertical axis is logarithmic.) These probabilities are small numbers; they become even smaller for larger numbers of decays; and they increase as the average decay level increases. All of this is perfectly sensible.
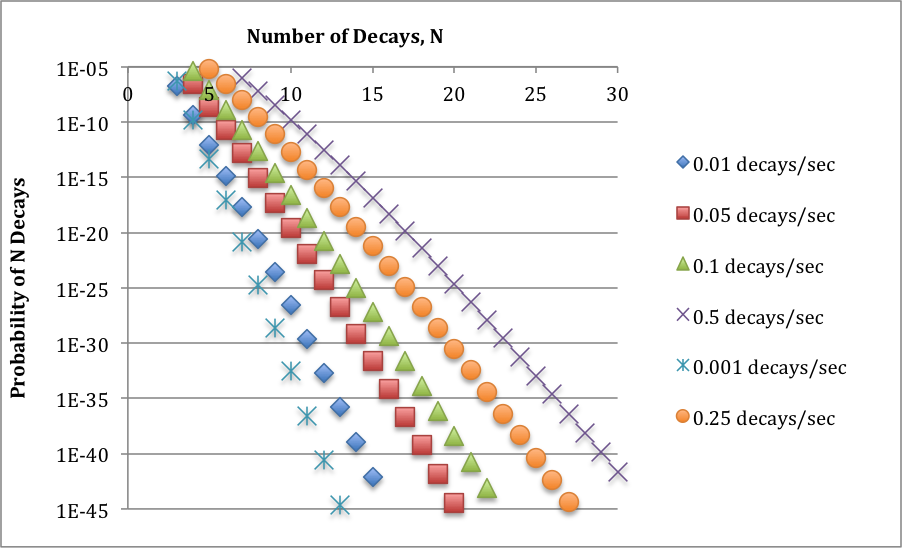
There is next a small piece of magic, which I will explore further in a subsequent post. The interesting probability level is around 10^-40. (It might be different by several orders of magnitude. This is envelope-back stuff.) Basically, this reflects the fact that we run the decay experiment over many, many interaction volumes: the 70 million cubic millimeters in a human body, the number of seconds in a year, and the number of bodies in a population. For each value of the average decay level, then, I read off the number of decays N at a probability of around 10^-40.
This is the largest number of decays we are likely to see in a one-second interval as the result of the low average decay rates we've examined. I've graphed this out below. I think it's remarkable that, at a decay rate of 0.001/sec (that's 1 decay in 16 minutes), we will almost certainly find an interaction volume with 10 decays in a one second interval. That's a difference of 10,000x.
Examining just the whole-body dose overlooks this effect altogether. Does that seem appropriate, or wise? I should reiterate again that this is very basic, undergraduate-level physics. I should be able to say to any physicist, "I'm examining the biological effects of shot noise in very dilute systems of radioactive particles," and he or she should understand much of what I've discussed here very quickly. Asking a physicist this is an experiment you should feel free to do yourself, by the way.
You should compare the graph above to the squares on the graph of excess lung cancer deaths from TMI, which I reproduce below. It is worthwhile to give some thought to the similarity, remembering that the measurements on the graph below no doubt deserve significant error bars.
— Aaron Datesman
April 24, 2011
Fishy Statistics
By: Aaron Datesman
Scientists like to reason by analogy. Possibly this is because they're lazy, which is sometimes true, and possibly this is just an idea that the SAT puts into their heads at a young age and which they are never able to shake. However, possibly it's also because the mathematical framework which the natural world obeys is universal. Because of this, sometimes it happens that what you know about one field of inquiry turns out to apply in a very different area.
Until recently, my professional field was the construction of astronomical receivers: specifically, detectors utilizing sensitive superconducting electronics. Similar to radioactive decay probabilities, the design of sensitive receivers requires the careful analysis of stochastic (random) effects. Perhaps this seems new to you, but it isn't - you most likely learned to call it "noise".
To give one concrete example, the sound you hear when you mis-tune an analog radio and turn the volume up is the result of statistical fluctuations in electron states. Statistical effects like those of the thought experiment in the last two posts are not abstract in the least - they are highly present in the everyday world and have significant practical impact. Statistical fluctuations in the density of air explain why the sky is blue, for instance.
One of the noise sources for which an astronomer must account when devising an observing strategy is known as shot noise. Fundamentally, shot noise in electrical circuits arises because electrical current comes in discrete packets called "electrons". If the average flow of current in a wire is 4 electrons in a given unit of time, it's quite likely that some intervals witness 2 electrons passing by, others 5, or 7, etc. This statistical variation limits the ultimate sensitivity of the receiver.
Radioactive decays also occur in discrete units - of single nuclei. Therefore, it should be no surprise that the same statistical rule governing shot noise also describes radioactive decay. Although I think it has nothing to do with fish, the relationship is known as Poisson statistics. For radioactive decay, the Poisson distribution relates the probability that N decays occur in a given volume in a given time (say, in one cubic meter in one second) to the average decay rate, N-bar:
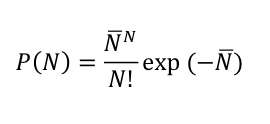
Let me illustrate with an example. This post about the Science article "Radioactive Plume from the Three Mile Island Accident: Xenon-133 in Air at a Distance of 375 Kilometers" noted that the air in Albany, NY, contained about 10 pCi/m^3 of Kr-85 from 1975 to 1979. This equates to about 1 decay per second in a volume of 1 cubic meter. One per second (1/sec) is the average decay rate, N-bar.
We can use the equation at the bottom of this post, along with the information that the half-life of Kr-85 is 10.76 years, to determine that a cubic meter of atmosphere with an average decay rate of one nucleus per second contains more than one billion atoms of Kr-85. This isn't a lot, as far as numbers of atoms go (it isn't even one part in one trillion), but it does represent a large reservoir from which more decays could occur in a given one second interval. Nevertheless, only the average decay rate in the volume contributes to the probability expression.
So, it's interesting to ask questions like this one: how likely am I to see 10 decays in one second in this volume of 1 cubic meter, rather than just the average rate of 1 decay per second? The probability is 10^-7, or 0.00001%. This is a small number, but there are a lot of cubic meters in the atmosphere, and a lot of seconds in a year. Somewhere, at some time, you are virtually certain to observe a decay rate of 10 per second - and even, once in a long while, much larger values.
(Just to show how the decay probability falls off with increasing N, the probability for 2 decays per second is 18% - six orders of magnitude larger.)
Over a large volume of many cubic meters and a long time, the number of decays must agree with the average decay rate. I feel it's important to understand, however, that large numbers of simultaneous decays absolutely must occur in individual volumes of one cubic meter somewhere at some time. The fundamental distinction is identical to the difference between instantaneous and average velocity, with which every student of Introductory Physics should be familiar.
Because a cancer five or twenty years down the road began originally in a single cell (or perhaps in a small group of cells), in my opinion it's clearly preposterous to relate health outcomes to whole-body doses calculated from an average decay rate. Due to statistical mechanics, the dose delivered to an individual cell can be MANY, MANY times higher than the average dose - rather counter-intuitively, if the average dose is low. This is basic undergraduate physics, and not at all open to dispute.
What is actually required is a statistical treatment relating the occurrence of high-dose disintegrations to the background rate. I am confident that the correct statistical treatment will show that it is entirely improper to estimate the health effects of low doses by linear extrapolation from high doses.
In which case, I have to ask: wouldn't it be better if the people telling us that small amounts of radiation aren't harmful had taken, you know, undergraduate physics?
— Aaron Datesman
April 22, 2011
Schwarzium Pennies
By: Aaron Datesman
The field of radiation physics is a mess, unit-wise. We have rems and rads, Sieverts, Grays, Curies, and Becquerels, just off the top of my head, with micro-this equal to 10 milli-that – or maybe the other way around. The fundamental quantities, though, are energy (in Joules) and rate (in inverse time). The latter is the basic meaning of the Curie – 1 Ci is equal to 37 billion decays occurring in one second.
It’s a weird unit, though, because as it’s applied it often seems to measure concentration. In the conventional sense of number of molecules per volume, however, the Curie does not measure concentration directly. For instance, a measurement of 0.01pCi/m^3 of Cs-137 certainly sounds small – it represents one decay in a cube one meter on a side in 45 minutes – but that isn’t really the whole story. There are 1.17 million atoms of cesium in that cube.
And, while it is extraordinarily unlikely, all of those million-odd unstable cesium nuclei could spontaneously decay all at once. (This is why I would prefer to refer to concentration rather than dose.)
Now, in the real world, one million simultaneous decays against an expected level of one decay will never occur. However, there are absolutely statistical effects at play in low-dose health effects which seem to have been ignored in the field. Wednesday’s Gedankenexperiment is a first step in the direction of examining this oversight and trying to understand what it might mean.
The solution to the puzzle relies on the statistical (one could also say random, or stochastic) nature of radioactive decay. In a time span equal to one half-life, each individual atom does indeed have a 50% chance of undergoing decay. However, this does not at all mean that exactly and only two of the four atoms of Schwarzium have decayed after five minutes. It’s necessary to employ some simple statistics to analyze the situation correctly. We’ll use pennies to represent atoms of Sw – heads for no decay, tails for decay.

Since each atom has two possible states, there are 2^4=16 possible combinations. To figure out the decay probabilities, we simply have to count how many of those 16 possible combinations correspond to 0,1,2,3, and 4 decays.
0 decays – zero Tails: only 1 combination1 decay – one Tail: 4 combinations (Tail in positions 1,2,3, or 4)
2 decays – two Tails: 6 combinations, (remainder from 16 total)
3 decays – three Tails: 4 combinations
4 decays – all Tails: only 1 combination
Therefore, the probability of 3 or 4 decays occurring in one half-life is (4+1)/16 = 31.25%. You probably survived……but it was closer than you might have thought. This is (yet another) example of how statistics can kill you, I guess. The real takeaway, though, is this: the decay process is random, not deterministic. Sometimes, in a given interval of time, many more decays will occur than are strictly expected based on the average value of the decay background. Benchmarking against the average value of the disintegration rate (0.01 pCi/m^3) obscures this reality.
When a large number of nuclei simultaneously disintegrate inside the body, the surrounding tissues receive a tremendous dose of energy - even though the concentration, and the average decay level - are low. As far as I can tell, the linear dose no-threshold model does not account for this reality whatsoever.
Over the next several posts, I will argue that stochastic effects make low concentrations of radioactive materials much more dangerous than is commonly assumed. The fundamental insight supporting this assertion is this: as the average number of decays in a given volume increases (because the concentration of radioactive materials increases), the probability of a large number of excess decays (above the average rate determined by the half life) occurring decreases. This is basic statistical mechanics - not controversial in the least.
The dose increases, of course, because the average number of disintegrations has gone up – but the likelihood of extreme events goes down. The net effect of these two conflicting trends is a slow increase in the frequency of dangerous, large-dose events with increasing (but small) levels of radioactive contamination in the environment. In fact, I’m reasonably sure the relationship is logarithmic. If I were better at math, I would have that fully worked out by now.
The first step will be to examine what choice of “interaction volume” is biologically appropriate. It doesn’t make any sense at all to consider the so-called “whole-body” dose when the range of an alpha particle in tissue is only 50 microns.
(By the way, the relationship between the number of cesium atoms in the cube and the half-life of cesium is
The relationship holds for any radioactive substance which undergoes one disintegration in the time interval t. Interestingly, for a given measurement of activity, the longer the half-life, the more material there must be.
Looking back at this graph, then, one reaches the non-obvious conclusion that there was more Cesium than Iodine in the fallout from Fukushima recorded in Illinois on 3/22/11. The half-life of Cs-137 is 30 years, while the half-life of I-131 is only 8 days. The ratio of the measured activity levels was about 6 in favor of Iodine, but the half-life of Cesium is more than 1000 times longer.)
— Aaron Datesman
Clinton vs. Clinton vs. Clinton
By: John Caruso
Hillary Clinton, yesterday:
"Colonel Gaddafi's troops continue their vicious attacks, including the siege of Misrata. There are even reports that Gaddafi forces may have used cluster bombs against their own people," Clinton said in a joint press availability with Dutch Foreign Minister Uri Rosenthal.
"In the face of this inhumanity, the international community remains united in our resolve."
You can't help but be inspired by her deep concern for the use of cluster bombs against civilians. Unless you have a functioning memory, that is, since this would be the same Hillary Clinton who voted against a Senate amendment that stated:
No funds appropriated or otherwise made available by this Act may be obligated or expended to acquire, utilize, sell, or transfer any cluster munition unless the rules of engagement applicable to the cluster munition ensure that the cluster munition will not be used in or near any concentrated population of civilians, whether permanent or temporary, including inhabited parts of cities or villages, camps or columns of refugees or evacuees, or camps or groups of nomads.
And the same Hillary Clinton who's part of an administration that carried out this attack:
A US cruise missile armed with cluster ammunition was used in an attack in Yemen in December which resulted in the deaths of 52 people, more than half of them women and children, according to a human rights watchdog. [...] Amnesty International has now released photographs of missile parts from the attack which appear to show that it was a BGM-109D Tomahawk cruise missile designed to be launched from a warship or submarine. Further images reveal BLU 97 A/B cluster munitions which spray steel fragments for 150 meters along with burning zirconium for igniting buildings.
And while we're at it, this is also the same Hillary Clinton who's married to Bill Clinton, who was praised by liberals everywhere for committing acts of cluster humanitarianism like these:
Adem Muncaj, an ethnic Albanian boy from Kosovo, recently found a bright orange container that looked like a soft drink can and brought it home to his family. They are now dead.
When the "soft drink can" -- actually a NATO cluster bomb -- exploded, Adem, his brother and mother, his uncle, an aunt and their three daughters were injured and died within minutes in the village of Velika Jablanica, near the town of Pec.
Reports reaching Belgrade May 14 say that 100 civilians were killed and 50 wounded by eight NATO cluster bombs dropped on the Kosovo village of Korisa at midnight.
The week before, 18 people died in the southern city of Nis while shopping at an open market in the middle of the day, killed by cluster bombs, which also reached a nearby hospital. NATO said it was a "mistake" while planes were bombing the city's airport.
But in Hillary's defense, I guess as long as the Obama administration doesn't actually launch one of those steel shard- and burning zirconium-filled Tomahawks within the borders of the United States, she won't be a complete hypocrite.
ALSO: The Libyans who've kindled such an unquestionably authentic and entirely believable sense of moral outrage in our Secretary of State might want to steer clear of weddings and funerals for a while.
— John Caruso
April 20, 2011
Radioactive Schwarzium
By: Aaron Datesman
One of the program activities we undertook at the nuclear power industry summer camp I attended in 1996 was an experiment to measure the activity of a radioactive sample. It’s a simple demonstration to perform: there’s a sample of some material with a short half-life, a proportional counter, and a stopwatch. At the end of three hours, we plotted out the data on a sheet of logarithmic graph paper, drew a line, and read off the half-life. Easy.
There’s a quirk, though, a little scientific twist which I failed to understand well at the time. Because the decay process is probabilistic rather than deterministic, the measurement suffers from a systematic uncertainty which cannot be removed. As it happens, if you measure 900 decays in an hour, what you can say with certainty about the next hour is only that you expect to see between 840 and 960 counts.
Because there were N decays and because N stands for an iNteger and because you probably can’t be a scientist if you can’t count up integers correctly, it’s sort of weird to be told that there’s an irreducible error present in this experiment. But it’s there, and it’s natural that it should be there. An analogy which is pretty easy to understand involves coin flips: if you flip a fair coin eight times, it’s pretty likely that you won’t get four heads and four tails, although that is the most likely outcome. The result of a large number of random outcomes, taken together, will tend toward a deterministic outcome (half heads, half tails, half-life) – but some scatter will always remain.
It’s noteworthy that, if you measure 16 rather than 1000 counts in an hour, your knowledge is even worse in a relative sense – the number of counts you expect to see in the next hour lies between 8 and 24. That’s an error of +/- 50%. This uncertainty has really fascinating implications for the health effects of low exposures to ionizing radiation, which I hope to expand on over the next several posts.
As preparation for the mathy-ness to come, I have a little thought(crime) experiment. It may be lethal for you. Sorry about that. This is the experiment:
You are locked in a room and cannot escape. The door operates on a timer, and will open in five minutes. In the room, along with you, there are four atoms of radioactive Schwarzium (Sw). Sw has a half-life of five minutes.The decay of radioactive Sw is tremendously energetic. If more than two atoms of Schwarzium decay in your vicinity, you will suffer acute radiation sickness and die.
Are you safe? Can you get out of the room before the third and fourth atoms of Schwarzium decay?
— Aaron Datesman
Honest!
What's infuriating about U.S. foreign policy isn't just its brutality, but the way it's accompanied by explosions of rhetoric about our love for All Humanity. Moreover, the rhetoric's always soaring yet bland, like watery vanilla pudding dropped on you from 30,000 feet.
So I appreciate this statement about Libya by Obama's Deputy National Security Adviser Denis McDonough, which I don't think has gotten enough attention:
"...we don't get very hung up on this question of precedent because we don't make decisions about questions like intervention based on consistency or precedent. We base them on how we can best advance our interests in the region."
Fair enough.
–Jonathan Schwarz
Why We're So Great
It's not just that we train criminals while we put heroes in jail. Any picayune empire can do that. And it's not even that we train criminals and imprison heroes in the exact same place. It's that we imprison a hero for revealing our discussions with a criminal about how he was trained where we imprison the hero. EsherEmpire!
The Defense Department said Tuesday it would transfer Army private Bradley Manning, accused of providing classified documents to WikiLeaks, to a new detention facility at Fort Leavenworth in Kansas from the brig at Quantico, Va.
State Department cable from Wikileaks:
"The King [of Bahrain] related how his own experience at the U.S. Army Command and General Staff College at Fort LEAVENWORTH, Kansas had been one of the most personally and professionally rewarding of his life; he praised the value of continued military education opportunities."
–Jonathan Schwarz
April 18, 2011
Tax Day Graphs
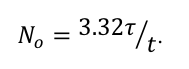
If I were teaching a class of smart 7th graders how to lie with statistics, I'd use the Heritage Foundation's Budget Chart Book. It includes everything you'd need in your toolbox if you wanted to bamboozle people in this particular way, yet it's simple enough that a 12-year-old could understand how they do it.
For instance, here's one of their charts:
The Top 10 Percent of Income Earners Paid 71 Percent of Federal Income TaxTop earners are the target for new tax increases, but the U.S. tax system is already highly progressive. The top 1 percent of income earners paid 40 percent of all federal income taxes in 2007, while the bottom 50 percent paid only 3 percent. More than one-third of U.S. earners paid no federal income tax at all.
The most important deception here is the phrase "U.S. tax system."* The federal income tax is, in fact, progressive. But it's by no means the entire U.S. tax system. There are also federal payroll taxes (regressive) and state taxes on income (generally flat), property taxes (generally flat) and sales (regressive). When all of that is added together, the system as a whole is only slightly progressive, and in fact is essentially flat from the middle quintile upwards. Here's a useful chart from Citizens for Tax Justice which includes all taxes:

* For extra credit, I'd have the smart 7th graders explain a less crucial but still important deception: whether there's any necessary connection between the (accurate) statistics Heritage gives about how much of the total federal income tax is paid by the top 1% and bottom 50%, and their statement in the previous sentence that taxes are "highly progressive." Obviously there isn't: we could have a flat tax, but if the top 1% earned 40% of all income, then they'd pay 40% of all income taxes. And if the bottom 3% only earned 3% of all income, then they'd pay 3% of all income taxes. Heritage doesn't want you to start thinking about that, so they leave out the percentage of total income earned by the top 1% and bottom 50%. (The top 1% earn about 24% of all income, up from about 9% in 1976.)
Here's another useful Citizens for Tax Justice chart that gives the relevant numbers for all taxes:

—Jonathan Schwarz
April 14, 2011
We All Should Have Paid More Attention to Logarithms
By: Aaron Datesman
I had a little fun with graphs earlier this week. Perhaps you would like to have a little fun, too? If your idea of fun involves inputting tables of mortality statistics into an Excel spreadsheet, then it would be rude of me to keep all the fun to myself! So, why wait for me? Here are the mortality tables (use the code “140-205 Malignant Neoplasms”); and here is the US EIA data on the energy produced by nuclear power plants in the U.S. It will probably be a little while before I finish the analysis myself….
The idea I took away from that thought experiment about cancer rates and fallout (aka “emissions”) from commercial nuclear reactors is this: perhaps the dose relationship (for low doses) is logarithmic rather than linear. Mathematically, this is expressed for the excess death rate and total energy produced simply as
![]()
Since the energy produced is exactly proportional to the number of radioactive fission products created by the process, this is about equivalent to a relationship between dose and harm.
Having trained in physics, I like this – it reminds me of statistical thermodynamics. Although I had mono that semester, it’s rather natural to see a logarithm here – therefore it “feels” right. At a basic level, this is true because of a result known as the Central Limit Theorem. Physics undergraduates ordinarily encounter this in the context of the “random walk” problem, but it’s a universal statement about the distribution of results subject to a large number of statistically independent random events.
Perhaps it was clearer when I said that it “feels” right.
So, the interesting thought is this: perhaps the linear model for low doses should be replaced by a logarithmic dose (or exposure) relationship. Is this crazy? Well, actually I’m not the first person to think of it. The Radiation and Public Health Project made this observation about an evaluation of the health effects of the Three Mile Island accident which was published in 1997:
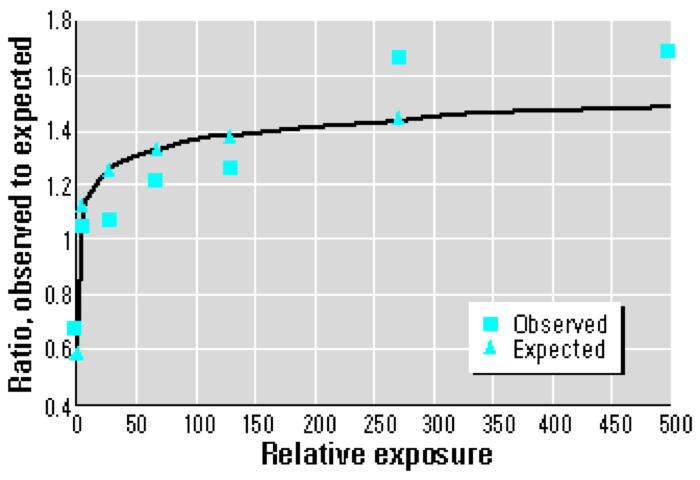
Plotting the O/E (Observed/Expected) ratios by level of exposure shows that the dose response does not conform to a linear model. Rather, a logarithmic or supralinear curve describes the relationship more accurately, as the greatest per-dose effects occur at the very lowest levels of exposure.
If I understand the graph below correctly, the author (Joe Mangano, whose analysis of thyroid cancer incidence I critiqued here) has fit a logarithmic relationship to the “Observed” data; the quality of the fit is determined by the vertical distance between the squares and triangles.
It may not be immediately clear, but a logarithmic model would be a very significant departure from the linear dose assumption upon which our judgments of safety are based. Using a linear model, for instance, reducing the dose by a factor of two reduces the health effects (typically, death) by the same factor. A logarithmic model, however, responds to a factor of two reduction in dose with a reduction in mortality by only an additive factor.
That is: if a logarithmic dose model applies, low doses of radiation are much more harmful than we currently believe.
So, how likely is it that our current operative understanding could be wrong? Well, the notoriously anti-nuclear organization known as the Federal Government of the United States of America has this to say about the health effects of low doses of ionizing radiation:
Since we cannot measure the stochastic [this means random, or non-deterministic, in the sense of the Central Limit Theorem - AD] effects of very low levels of exposure, health physicists must extrapolate the risks from what they know about high levels of exposure. Most radiation protection organizations estimate the risk of health effects from low levels of exposure, all the way to zero exposure, as proportional to those of high levels of exposure.
According to the Environmental Protection Agency, our beliefs about the safety of low levels of radiation are guesses based upon knowledge of the effects of high doses and the assumption of a linear dose model. Fortunately, I guess, we have the opportunity to assess whether that assumption of a linear dose model is correct – by graphing out the mortality statistics from a dangerous experiment we are performing on ourselves.
I actually don’t find that to be very much fun at all.
- Aaron Datesman
Then They Came for Dana Milbank
For the past 20 years, as the U.S. middle class has quietly collapsed, Dana Milbank has made a great living as a media liberal who constantly ridicules liberals. But recently it seemed as though he'd suddenly noticed something was going on. Why? Because it was happening to him and his "brand-name MBA" wife, who were being screwed by Citibank after they'd refinanced their mortgage. (In fact, while he didn't mention it, his wife actually once worked for Citibank.) Now Milbank understood that "big banks" needed to be "brought to heel."
Except...after his brief encounter with reality, Milbank has gone right back to telling us what losers liberals are. Did you know the House Progressive Caucus has come up with some kind of preposterous socialist budget? But they didn't move the press conference inside even though it was raining! And they were all carrying umbrellas! What a bunch of nimrods! Ha ha ha ha ha ha oh crap look at the caller ID that's Citibank again ha ha ha ha ha ha!
First they came for the welfare mothers, but I did not speak out, because I was a member of Skull & Bones.
Then they came for middle-class manufacturing unions, but I did not speak out, because I had to get to a party at Marty Peretz's.
Then they came for the upper middle class people who didn't have columns in the Washington Post, but I did not speak out, because Dennis Kucinich is short.
And then they came for me...and I was STILL so fucking stupid that I spent my time making fun of the House Progressive Caucus.
—Jonathan Schwarz
April 11, 2011
Morbid Fun With Graphs
By: Aaron Datesman
I wrote here about my dissatisfaction with the dose model, although probably without enough scientific support for the part everybody focused on at the end. (I’ll return to it eventually, since I think it’s pretty interesting. There were especially some smart comments which enhanced my understanding and helped to clarify my own thinking.) The post contained one other point which is at least equally significant: the dose model lumps the distinct biological effects of different kinds of emitters together into one number. This isn’t biologically justified; it’s “computationally convenient”.
Although I first encountered the linear dose model in 1996, I didn’t think to question it much until the end of my short career in the nuclear industry. My skepticism emerged during the last several months of 2005, which I spent writing a very long report on radiation effects in (non-biological) materials. As November slipped into December, and the stack of academic papers and government reports on my desk passed twelve, and finally twenty-four inches, I was overwhelmed with conflicting information about defect mechanisms, thermal healing rates, and dose measurements for different radiation spectra. So, what did my colleague and I do?
We did what engineers are trained to do: we picked the papers we understood the best, summarized the results for our bosses, and then constructed a linear model from which we extrapolated recommendations for experimental study. The report is still classified, or I would share it here. We were aware that our report failed to capture very much insight compared to all of the literature we had surveyed; but it’s standard operating procedure, so it’s what we did.
A silly but accurate explanation of the problem we confronted goes like this: the dose model takes apples (alpha), bananas (beta), and grapefruits (gamma), transforms them into pineapples, and then feeds us pineapples in all sorts of forms (in cake, as fermented juice, by throwing them at us, and many others), in amounts small and large, over time periods short and long, in order to determine whether we are allergic to apples, bananas, and grapefruit. If anything, this is a bigger problem for animate biological materials than it is for inanimate materials.
I think about this whenever I hear the claim that, since “background radiation” is safe, the small dose increment which human activities have added to the background (around several percent in most locations) also must be safe. This is wrong. For instance, a commenter pointed me toward the article “Cancer Incidence in an Area Contaminated with Radionuclides Near a Nuclear Installation”, which contains this worrisome piece of information:
The DOE station at the eastern (downwind) boundary of the plant has recorded an average concentration of 2072 attocuries/m^3 (aCi/m^3) of plutonium over the eight year period, compared to 32 aCi/m^3 for New York City….
That 32 aCi/m^3 of Plutonium measured in New York City is a small contribution to the activity of the background radiation, but understand this: there was never one atom of Plutonium on Planet Earth until humans made some. Even if the naturally-occurring background radiation (principally due to radon and cosmic radiation) is safe for humans (and we have no way to know this, since there can be no counterfactual), there is absolutely no scientific basis for lumping any amount of plutonium contamination into the natural background, and concluding that miniscule amounts of plutonium in the environment therefore are also safe.
It is absolutely unjustified. Not only is the conclusion of safety absolutely unjustified for plutonium, but it is also almost completely unjustified for other radioactive materials released by nuclear weapons testing and by releases from nuclear reactors, including strontium, cesium, and iodine. Converted to pineapples, the levels of these radionuclides are indeed small; however, compared to their near-zero natural abundances, the levels of these materials are vastly larger than any sensible definition of a “background” level.
But how to tell whether these low levels of released materials are harmful? Due to confounding factors including smoking, chemical exposure, and not calling your mother often enough, it’s essentially impossible to tell directly. The issue can only be resolved experimentally: for instance, by large-scale epidemiological (medical) studies. As a thought experiment, however, I might suggest shutting off all of the nuclear reactors all over the world while monitoring the rate of cancer mortality. Maybe even just turning them down would be enough, in fact.
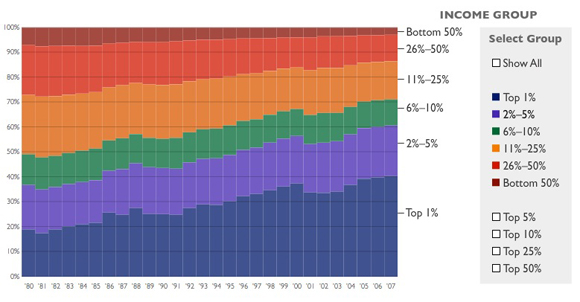
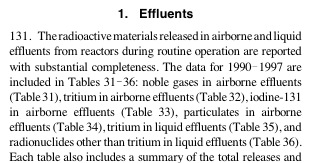
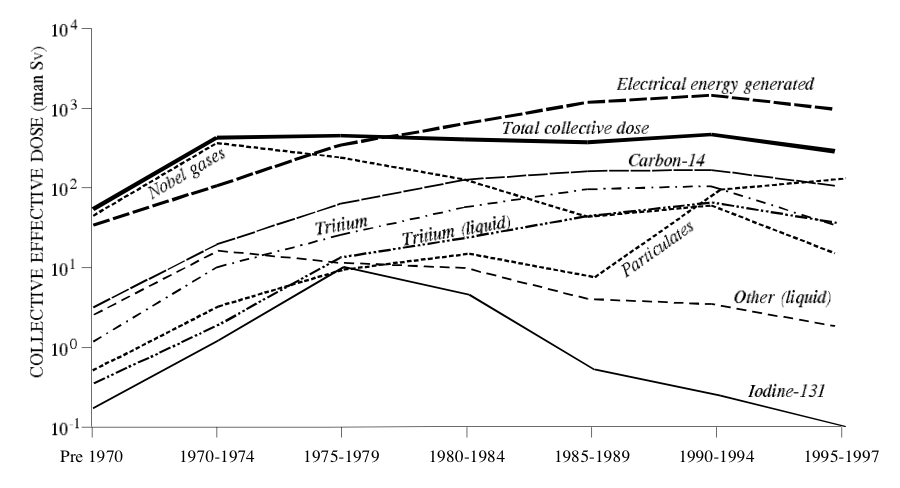
I thought of this as I browsed through Annex C of the 2008 Report of the United Nations Scientific Committee on the Effects of Atomic Radiation (UNSCEAR). It is one of the documents upon which George Monbiot bases his new pro-nuclear opinions.
I agree that the report is very interesting, although probably Monbiot and I did not find the same parts interesting. What I found interesting was the section about radioactive effluents from routine operations of nuclear reactors (pages 183-187). Somehow, despite my brush with the nuclear industry in 1996 and my employment in the industry in 2005, until recently I was under the impression that no such thing as releases of radioactive effluents due to the routine operation of nuclear reactors exists.
UNSCEAR also provides a handy graph, which I reproduce below. An interesting feature of the graph is that it provides a line for “Electrical energy generated”. You should note that, inherent to the process of generating power from fission, the more energy generated, the more radioactive byproducts are produced. (They don’t have to be expelled to the environment, but they must be produced. The relationship is proportional.)
Thanks to the internet, which makes many things easy that used to be impossible, it occurred to me to look up the incidence of cancer in the U.S. by year. I didn’t spend long on it; I’m sure I could find a better source. But all I wanted to do was to make two graphs, mash them together, and think about them. So, I did:
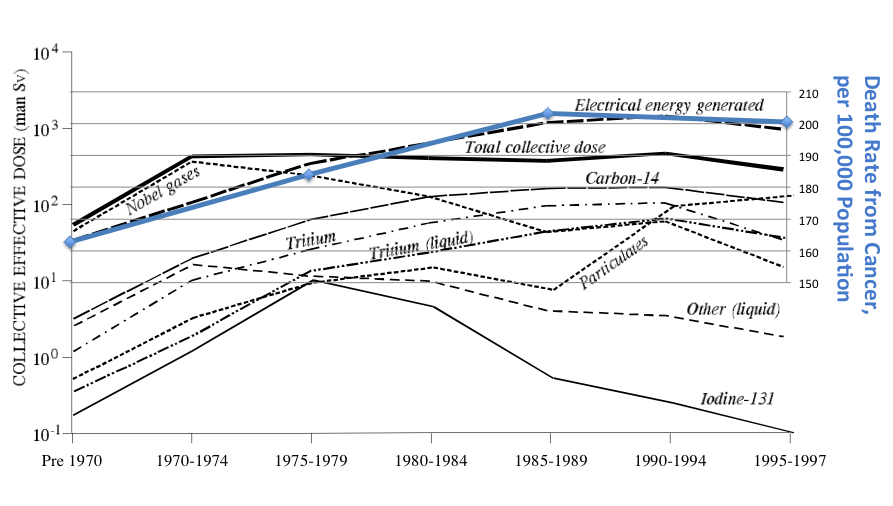
I acknowledge all sorts of problems with this scientifically, and myself don’t consider it anything more than a picture to go “Hmmmm…..” at. Therefore, although I’m tempted to write more about it, I think I’ll allow the graph above to speak for itself.
— Aaron Datesman
April 09, 2011
TMI and Thyroid Cancer
By: Aaron Datesman
This post is about a report from the Radiation and Public Health Project about thyroid cancer. I admire the organization - especially their “Tooth Fairy Project”, which aims to track levels of strontium fallout - but I think the conclusions of their report are wrong. The alternative explanation I would like to offer relates to the Three Mile Island accident. It is a good illustration of the nature of fallout dangers, I hope, and certainly a cautionary warning (if true) about how corrosive an incorrect media narrative can be - even many years into the future. I will steal from the RPHP report to set the stage:
Thyroid cancer incidence is increasing more rapidly than any other malignancy in the U.S. (along with liver cancer), rising nearly threefold from 1980 to 2006. Improved diagnosis has been proposed as the major reason for this change by some, while others contend that other factors also account for the increase. Among U.S. states, 2001-2005 age-adjusted thyroid cancer incidence rates vary from 5.4 to 12.8 per 100,000. County-specific incidence data available for the first time document that most U.S. counties with the highest thyroid cancer incidence are in a contiguous area of eastern Pennsylvania, New Jersey, and southern New York. Exposure to radioactive iodine emissions from 16 nuclear power reactors within a 90 mile radius in this area as a potential etiological factor of thyroid cancer is explored; these emissions are likely a cause of rising incidence rates.
Uptake of radioactive Iodine-131, released from nuclear weapons tests and nuclear reactors, is accepted as a cause of thyroid cancer. (I recommend this article by Valerie Brown if you are unfamiliar with this topic.) Thyroid cancer is highly survivable, so it’s interesting to have incidence, rather than mortality, data. The table below is taken from the RPHP report. It lists the 18 U.S. counties with the highest rates of incidence of thyroid cancer. My childhood home of Lehigh County, PA, tops the list.
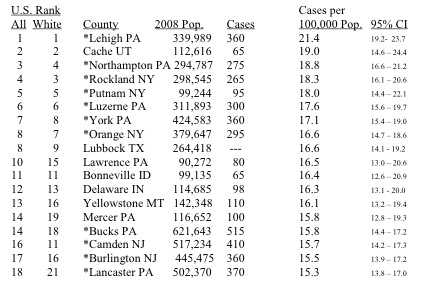
You’ll notice the eleven stars in the table. These are all counties clustered together in southeastern Pennsylvania, New Jersey, and downstate New York. This region contains the highest density of nuclear power plants in the country – thirteen operating reactors at seven distinct facilities.
In addition to this general argument, which you may find convincing, the report examines in greater depth incidence data for the area surrounding one reactor - Indian Point in Westchester County, NY. While Westchester County is not on the above list, the adjacent counties of Putnam, Orange, and Rockland all are. The authors find that the incidence of thyroid cancer in these four counties is more than 40% greater than in the rest of New York state. In 1976, the incidences were identical.
Aside from some discussion of other factors which may contribute (more on that in a moment), this is the conclusion to the report:
Geographic variations in mortality and incidence have been frequently used to reveal etiological factors for diseases. This report addresses the largely unexamined topic of geographic variation in U.S. thyroid cancer incidence and has identified proximity to nuclear plants as the most evident etiological factor. This finding is consistent with data in the U.S. National Cancer Institute study of cancer near nuclear plants, which documented consistent rises in thyroid cancer incidence in counties closest to nuclear plants after startup. Data in this report suggests that exposure to radioactive iodine released from nuclear plants is a factor in elevated and rapidly rising thyroid cancer rates.
This conclusion may be correct; there is probably information in the data presented which supports it. I do agree that iodine releases from operating reactors are certainly a matter of serious concern. However, the county-level data presented by RPHP support a much stronger explanation than the rather vague hypothesis regarding the regional concentration of nuclear reactors.
It’s not the fault of the authors that they overlooked this explanation. It’s the fault of the media, which for more than 30 years has failed to inform us regarding the true scope of the TMI disaster. This is from the section of the RPHP report which examines other sources.
Three Mile Island. Another source of exposure to radioactive iodine, especially in the northeast U.S. is airborne emissions from the 1979 accident at the Three Mile Island plant. Official reports estimated 14.2 curies of I-131 and particulates were released into the environment, and prevailing winds carried the radioactivity hundreds of miles to the east and northeast. But the 2001-2005 thyroid cancer rate Dauphin County PA, where the reactor is located, had a rate of 12.0, lower than many other counties in the state. Again, while 1979 Three Mile Island emissions may play a factor in subsequent thyroid cancer state and county, these data suggest it is not a major contributor.
There’s an interesting error here. The error also occurs in this article from the academic literature entitled “Incidence of thyroid cancer in residents surrounding the Three Mile Island nuclear facility.”
OBJECTIVES/HYPOTHESIS: On March 28, 1979, the worst nuclear exposure incident in U.S. history occurred near Harrisburg, PA. Small quantities of xenon and iodine radioisotopes were released into the environment from the Three Mile Island (TMI) nuclear power plant. The Pennsylvania Department of Health (PDoH) implemented a TMI Population Registry, including 32,135 individuals within a 5-mile radius of TMI, to track possible health effects to the local population. Although no increase in cancer mortality has been noted in this cohort, cancer incidence has not been tracked. Given the long latency period for the development of thyroid cancer after exposure to low-level radiation exposure, it is plausible that an increase in thyroid cancer incidence might just now be occurring…..CONCLUSIONS: Thyroid cancer incidence has not increased in Dauphin County, the county in which TMI is located. York County demonstrated a trend toward increasing thyroid cancer incidence beginning in 1995, approximately 15 years after the TMI accident. Lancaster County showed a significant increase in thyroid cancer incidence beginning in 1990. These findings, however, do not provide a causal link to the TMI accident.
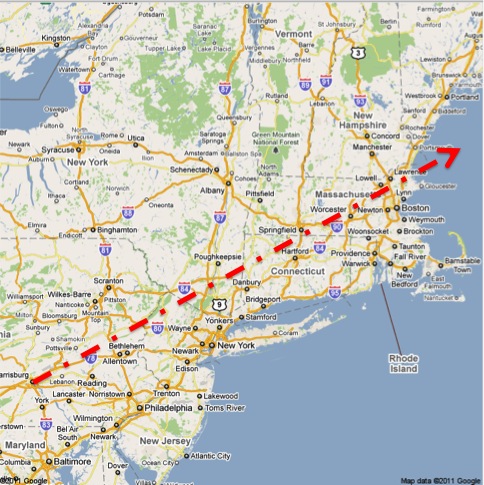
Three Mile Island lies at the extreme southern tip of Dauphin County, adjacent to both York and Lancaster Counties. Since fallout dispersion patterns are determined by the wind, it’s suspicious to base an argument about fallout and fallout effects in Dauphin County on TMI’s location in Dauphin County. When I got the idea in my head that the authors of these papers may not have examined the geography very carefully, I graphed it out myself. You may want to compare the map below to the map in this post about the article in Science (Wahlen et al.) discussing TMI fallout measured in Albany.
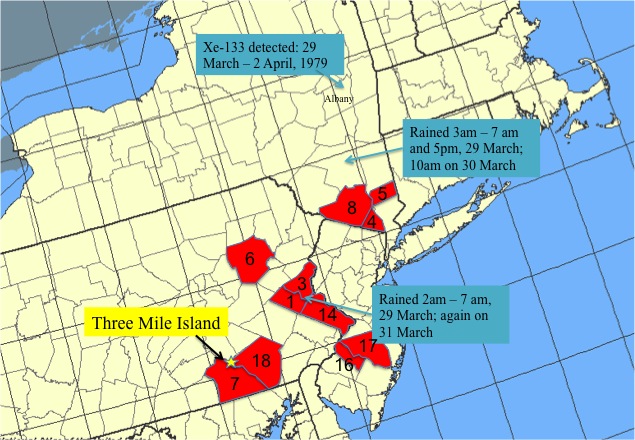
The counties are labeled according to their rank in the incidence chart. (I grew up in the county labeled “1”.) I don’t see much evidence here that the regional concentration of nuclear power plants is related to the incidence of thyroid cancer. Of the seven regional nuclear facilities, only Peach Bottom in Delta, PA, is located in one of the counties highlighted in red. Although I believe the argument that TMI fallout might not land in Dauphin County, I don’t believe that all nuclear plants by necessity are sited on county boundaries. (I may be wrong about this. If somebody would care to look this up, I would appreciate the favor.)
There are not any nuclear power facilities in Lehigh(1), Northampton(3), and Bucks(14) Counties, although it is true that none of those locations is very far away from the Limerick power station in Montgomery County (which is not itself in the top 18). However, if routine (and even permitted) emissions of radioactive iodine are the fundamental cause, it’s very hard to explain why Lehigh County(1) and Lancaster County(18) both have high rates, while Berks County between them does not.
A much likelier explanation is a single, large emission of radioactive iodine which, due to geographical variations in the weather, resulted in an inhomogeneous pattern of fallout. In short, on the day of the Three Mile Island accident, there was scattered rain in southeastern Pennsylvania and downstate New York. You’ll notice that the three clusters (7/18, 1/3/14, and 4/5/8) of red lie quite well along a track parallel to the weather track for 28 March 1979 described in the previous post.
That’s one error based upon careful analysis of geography. (It’s perhaps something only a hometown boy would think of.) There’s possibly a second error, also. What if the estimate of the emissions of Iodine-131 due to the Three Mile Island accident were wrong – by a factor of more than 50,000?
For example, the official story is that the TMI incident released only 13 to 17 curies of dangerous iodine into the outside environment, a tiny fraction of the 13 million curies of less dangerous radioactive gases officials say were released, primarily xenon. Such a number would seem small compared with, for example, the 1986 nuclear accident at Chernobyl, which released anywhere from 13 million to 40 million curies of iodine and is linked to 50,000 cases of thyroid cancer, according to World Health Organization estimates.But the Thompsons and Bear point out that the commission's own Technical Assessment Task Force, in a separate volume, had concluded that iodine accounted for 8 to 12 percent of the total radioactive gases leaked from Three Mile Island. Conservatively assuming the 13 million curie figure was the total amount of radioactive gases released rather than just the xenon portion, and then using the Task Force's own 8 to 12 percent estimate of the proportion that was iodine, they point out that "the actual figure for Iodine release would be over 1 million curies" - a much more substantial public health threat.
I included on the map historical weather data for Allentown, PA (in the county labeled “1”) and Poughkeepsie, NY (a bit north of county “8”). The information that there were scattered showers in New York and Pennsylvania on 29 and 30 March 1979 is significant because rainfall is the principal means by which radioactive fallout actually falls to earth. The below is excerpted from a report by the National Cancer Institute titled Whatever It Looked Like, We Didn't Drop Bombs on You: So Why Worry? Oh, no. I mean, titled Estimated Exposures and Thyroid Doses Received by the American People from Iodine-131 in Fallout Following Nevada Atmospheric Nuclear Bomb Tests .
Precipitation, hereafter used interchangeably with the words rain or rainfall, efficiently scavenges particles suspended in the atmosphere and can result in much greater deposition than that due to dry processes such as sedimentation, impaction, and diffusion. However, although a substantial fraction of the amount of radioactive materials present in the air may be scavenged by rainfall at particular locations, the fraction of the whole radioactive cloud so removed during one day is small.Nuclear weapons were detonated when dry weather was predicted so that the deposition of radioactive materials onto the ground in the vicinity of the NTS would be as low as possible. However, because dry conditions were seldom maintained over the entire U.S. for several days after each shot, rainfall represents the primary means by which 131-I was deposited east of the Rocky Mountains.
The report makes very disturbing reading. Of course, so does this testimony belonging to Robert and Lena Zeigler of York Haven, PA, found on the Three Mile Island Alert web site:
ROBERT: And another thing I want to tell you. This patio out here. The very second day it rained. I never in my life seen it before. Where that rained on that patio, it was as purple as that towel there.LENA: A reddish brown.
ROBERT: Just like you took maybe a spoonful of blood and dumped maybe a quart of water in it. And that went on there for a year or so, wasn’t it. It was the same thing every time. You could see it as soon as it rained. It’s still not clean. See what I mean. Now here, I had a lifetime roof put on here. It’s a sixty pound weight tin. The man told me it was a lifetime guarantee. I could go up there a month after this [accident] happened and just punch holes in my roof. It just ate that roof right up.
York Haven is in York County(7), very near to Three Mile Island. You are no doubt aware of what color water takes on when iodine compounds are dissolved in it. I will only add that, although we add it to salt, iodine is quite toxic (a lethal dose is 4 grams) and highly corrosive to metal.
It’s very plausible that the high rates of incidence for thyroid cancer in southeastern Pennsylvania and downstate New York identified by the Radiation and Public Health Project are due to fallout from Three Mile Island. As one final piece of supporting evidence, I offer this summary of the weather conditions around TMI on the day of the accident, March 28, 1979. This is taken from the Science article “Radioactive Plume from the Three Mile Island Accident: Xenon-133 in Air at a Distance of 375 Kilometers”:
For the first release period on 28 March, the meteorological conditions at Middletown were rather stagnant, with medium- to low-speed winds gradually shifting from northwesterly to northeasterly to easterly and finally to southeasterly. From 29 to 31 March, southwesterly winds prevailed at increased speed.
Following that description, a release from Three Mile Island on 28 March would have been blown over York(7) and Lancaster(18) Counties before assuming a track toward the northeast. I believe that is the story the map above tells as well.
(Full disclosure: the piece of this I can’t figure out is why the scientists in Albany didn’t detect any Iodine-131. If anyone can puzzle this out, please let me know.)
— Aaron Datesman
April 08, 2011
Glenn Greenwald, Unicorn
By: John Caruso
It seems all my postings lately involve the avoidance of being remiss, and that's what I'd be yet again if I didn't highlight this bit of commentary from Glenn Greenwald:
[I]f you were a Democratic Party official, wouldn't you also ignore -- and, when desirable, step on -- the people who you know will support you no matter what you do to them? That's what a rational, calculating, self-interested, unprincipled Democratic politician should do: accommodate those factions which need accommodating (because their support is in question), while ignoring or scorning the ones whose support is not in question, either because they will never vote for them (the hard-core right) or will dutifully canvass, raise money, and vote for them no matter what (the Democratic base). Anyone who pledges unconditional, absolute fealty to a politician -- especially 18 months before an election -- is guaranteeing their own irrelevance.
Why does this sound hauntingly familiar to me? Oh, right, because of this and this and this and this and I think we'd both agree that's enough of that for now, wouldn't we. I've spent so much time riding this hobby horse because I've always felt it's one of the most important domestic political questions (if not the most important). Or as Greenwald puts it, it's "one of the most important domestic political questions (if not the most important)". Gaaah! Stop doing that!
As I've said before, I give Greenwald tremendous credit for continuing to follow his principles wherever they lead even now that President Fleshword has taken up residence in the White House. It's a rare person—and a downright unicornesque high-profile liberal blogger—who chooses that path over partisanship. And he's paying a price for it; I regularly see him being slagged in the comments sections of liberal blogs and media outlets for the exact same kinds of observations that won him ringing praise when he was applying them to Bush. If he keeps this up, he may find that instead of writing for Salon he's reduced to tapping out his opinions on some obscure blog somewhere. Ha ha ha ha! Oh, wait.
— John Caruso
April 05, 2011
Science to the Rescue
By: Aaron Datesman
There is an interesting story on the Three Mile Island Alert web site which I’ve so far neglected to mention. It surprised me a lot when I first read it: I thought (yet again!), how can it be I’ve never heard this? Charles Armentrout was a physics professor in Portland, Maine, when he detected radiation from fallout from the accident in April, 1979.
Thirty years ago, April 1, 1979, on the rooftop of a building at the University of Southern Maine in Portland, a nuclear radiation recording device went from being relatively quiescent to rapidly recording extremely high levels of beta radiation, 100 times the normal background levels.The equipment had been set up by USM physics professor Charles Armentrout a few days earlier as a teaching project for his students to see if any fission products from the Three Mile Island power plant accident could be detected in Maine. It was a rainy Sunday, five days after the partial meltdown at the power plant just southeast of Harrisburg, Pennsylvania.
In Portland the wind had been from the southwest and then shifted to come in off the ocean. It was then that the professor's pulse frequency counter began to go crazy. A second counter brought to the roof did the same thing, so Armentrout knew his readings were real. This was equipment that had required him to obtain federal and state licences to operate and which he was also required to have periodically calibrated at the state's radiology lab in Augusta.
The article goes on to describe government denials and contradictory claims involving nearby monitoring stations and claims about radon, all of which leave the lay reader without an intelligent basis upon which to form an opinion. On my first couple of readings, however, somehow I missed the most interesting piece of the article: corroborating evidence from Albany, NY, was published in Science magazine less than a year later. Naturally, I went ahead and looked up the article:
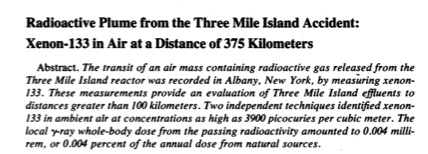
Science magazine is an esteemed scientific journal. It’s a very big deal to have an article published there. I should add that Science magazine is also to the scientific community sort of what the Washington Post is to a certain variety of Serious People: it’s the repository of accepted beliefs. I’m still shocked to discover that this article made it through review and was published there.
On the other hand, it may be that the totally benign health estimate of 0.004 millirems whole body dose in the abstract had something to do with the publication decision. In that vein, you should take a moment and examine the last sentence in the abstract again. Go ahead, do it. It won’t hurt you.
Do you see? That’s the gamma ray dose. Xe-133 is a beta emitter – which the authors knew very well, since their article described measurements they made of the beta decay spectrum. The benign dose estimate the article gives is based upon assumptions which throw away nearly all of the negative effects. It’s somewhat noteworthy that the relevant reference in the article - which I imagine the authors cite because they used it as a guide for determining the health effects due to exposure – is a document from the U.S. Atomic Regulatory Commission entitled Regulatory Guide 1.4: Assumptions Used for Evaluating the Potential Radiological Consequences of a Loss of Coolant Accident for Pressurized Water Reactors.
Despite that rather questionable health physics calculation, the article includes a lot of really fascinating information, including good information about the weather conditions and atmospheric transport from the days following the accident. I think this piece is interesting:
For the first release period on 28 March, the meteorological conditions at Middletown were rather stagnant, with medium- to low-speed winds gradually shifting from northwesterly to north-easterly to easterly and finally to south-easterly.
It occurs to me that a slow northeasterly wind would blow from TMI in the direction of the Holowka farm in Zion’s View.
Although they found very high concentrations (3900 pCi/m^3) of Xe-133, the authors did not find high levels of two other radioisotopes for which they were looking: I-131 and Kr-85. I think this is interesting in light of some of the TMI release estimates which Arnie Gunderson has put forward, but that’s a topic for another post.
The thing about the article which I find most alarming, however, is the information it rather blithely contains about “routine releases from nuclear reactors”:
In 1974 the concentration of Xe-133 from all sources including routine releases from nuclear reactors was 2.6 pCi/m^3 for the Albany area.
The Kr-85 measured … within the range of 10.9 to 18.4 pCi/m^3 encountered in samples of Albany air for the period 1975 to 1979.
Frankly, when I first began to learn about this topic in 2009, it was news to me that there are such things as “routine releases” from nuclear reactors resulting in measurable levels of radioactivity in the local environment. But, there it is – in Science magazine.
Lastly, I would like to share a final note about geography. First, from the Science article:
The mean transport layer forward trajectories for this period passed 80 to 160 km south of Albany.
Second, from the TMIA article about Prof. Armentrout in Portland:
In Portland the wind had been from the southwest and then shifted to come in off the ocean.
On the map below, I have drawn a line from the location of Three Mile Island to a point 120km south of Albany, NY. (The line is a guide for the eye, not an indication of where fallout landed or did not. There was a very high level of radiation measured in Albany, which is around 100km away from any point on the line. Envision a cloud centered on the line instead.) You can see that the line ends up over the Atlantic Ocean east of Portland, ME.
It also rolls almost right across my childhood home in Lehigh County (Allentown/Bethlehem, PA).
— Aaron Datesman
Zobambies! (The Return of the Liberal Dead)
By: John Caruso
Since I poked Kevin Drum just last week, I'd be remiss if I didn't take a moment to acknowledge his publication of this extraordinary bit of credibility auto-demolition:
But the reason I voted for Obama in 2008 is because I trust his judgment. And not in any merely abstract way, either: I mean that if he and I were in a room and disagreed about some issue on which I had any doubt at all, I'd literally trust his judgment over my own. I think he's smarter than me, better informed, better able to understand the consequences of his actions, and more farsighted. I voted for him because I trust his judgment, and I still do.
As I read this I couldn't help but be reminded of CommonDreams commenter Joe Hope, who wrote the following immortal words (and many more just like them) shortly after Obama's election:
Obama is my commander (in-chief) and I trust him. Okay, so here's the tricky part. In a war, it is not the duty of a foot-soldier to develop the entire strategy for the war, nor is it the duty of a foot soldier to decide what orders to obey and which to disobey. No war could be won by an army governed by anarchy.
In this war, (against radical Right-wing government and social forces) it is up to Obama to craft a winning strategy, not us - the disorganized rabble. When we judge his strategy in a negative light, our criticism is ignorant, because we do not know what his full strategy entails. Keep in mind, it would be foolish, in a state of war, to simply divulge what that strategy is. So we must have faith in Obama and trust him. If we want change (and I know I do) then we must trust him, even when we feel we can't. We must see beyond our fears, and remember that sometimes it is more important to follow than to try to lead. The Left does not need more wannabe leaders and more petty infighting. It's like each of us has a piece of a puzzle, but only Obama can put the pieces together to create an image for our future.
Separated at birth, maybe? Hard to say. But in fairness to Mr. Hope, he was writing in 2008 and I'm guessing by now he probably feels some serious twinges of regret, whereas Drum offered his subordination of self right here in 2011, after the burden of proof has been more than satisfied and the jury's verdict is a foregone conclusion to any objective observer. The mind, she boggles.
All I can say to Drum is, you stay away from my tasty brains.
(Drum posted a followup in an attempt to do some damage control for his reputation, if you're interested. The most notable part for me was his peremptory dismissal of various critics "who simply find it risible that I think well of Obama in the first place"; in Drum's world, apparently, you're not worthy of consideration unless you were snowed by Obama at some point along the way.)
— John Caruso
April 04, 2011
Not A Super Model
We’ve all done the problem in high school physics with the cannon and the muzzle velocity and the launch angle, where the teacher asked us to find the range of the projectile. It’s standard. It’s also standard to begin the problem statement with the qualification, “Neglecting air friction….” If the cannon is a rocket and you took the class in college, perhaps you were told to neglect the rotation of the earth as well. There’s nothing remarkable about this.
It’s a somewhat simplistic example, but what I’ve just described is a powerful mode of physical reasoning employing a model. We can’t solve the actual scenario where the wind is blowing at different speeds at different heights, the air friction is a complicated function of velocity, and the earth is spinning – in fact, most of those parameters cannot be known explicitly and can’t be stated. So we invent a simplified, model problem which we can solve exactly, in the expectation that the answer will be sufficiently close to real life to be useful.
The use of models to address research questions is often unstated; but, once you have trained yourself to look for them, they are completely ubiquitous in all fields of science and engineering. When the model assumptions are justified, the technique represents a sublime application of human intellect. When the model assumptions are unrecognized or unexamined, however, GIGO is the operative rule: Garbage In, Garbage Out.
Since the Fukushima disaster began to unfold, I have been thinking a lot about an important model with a GIGO outcome: the Linear Dose Model (and its variants, including the Linear No-Threshold Model). The LDM relates dose of energy absorbed from ionizing radiation to health impacts, as shown in the graph below. Unfortunately for all of us, the LDM is based on ludicrous simplifying assumptions. If we truly understood this, we would throw rocks at commentators who try to reassure us with comments like “less than one-tenth of the dose from a chest X-ray”.
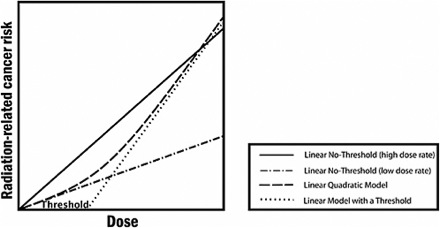
The graphic is from a report for the National Academies, Health Risks from Exposure to Low Levels of Ionizing Radiation: BEIR VII Phase 2. It was published in 2006. It looks very scientific, doesn’t it? Well, if you’ve ever been a science student working on a problem set at 2 a.m., figures like the graph above look very familiar. They all have the same legend, too. That legend says, “I Have No Friggin’ Idea, So Let’s Start With Something Really Simple”.
Don’t believe me? Well, this is from the caption to the figure:
The committee finds the linear no-threshold (LNT) model to be a computationally convenient starting point.
“Computationally convenient”, you will notice, does not mean “based on a scientific and thorough understanding of fundamental biology”.
There are actually at least two assumptions in this model. The first is not even hidden, but it’s so widely accepted that it’s very difficult to see it. Why is the absorbed energy (measured in Joules/kilogram), or dose, the appropriate metric to employ as the independent variable? It isn’t at all clear that this should be the case. I believe that the origin of this idea must be the Nobel Prize-winning work on X-ray mutagenesis by H.J. Muller, but there are two problems with its application.
1.A. Muller identified a clear correlation between dose of ionizing X-ray radiation and lethal mutation. He published his results in a famous paper titled “The Problem of Genetic Modification”. It escapes me, however, why anyone would assume that the pathway identified by Muller would be the ONLY means by which radiation can induce cancer. Yet this is certainly an assumption upon which the model relies. If we knew enough about cancer to know whether this assumption is justified, we would have cured cancer by now.
1.B. Cancer caused by radioactive fallout encompasses a range of chemical (strontium accumulates in bone, iodine in the thyroid, etc.) and radio- (alpha, beta, and gamma emitters, in addition to neutrons and fission products, all with a broad continuum of energies) activity. Lumping them all together into an “effective dose” using relative weights for different isotopes is what engineers refer to as a “kluge”. (This is a bit unfair to the cited BEIR VII report, which examines only gamma and X-rays. But the models cited are in fact applied to all forms of radiation, which I find hard to justify in general.)
I am actually sympathetic to the dose assumption. For one thing, I like the physics. If you’re trained in the field, then it’s sensible to think in terms of mass attenuation coefficients, linear energy transfer, cascades, and such things. But you should note that calculation of quantities such as these refer to model biological systems which are inanimate. This sounds complicated, but all it means is that dose calculations treat living beings as though they were not alive.
For another thing, I agree that, in the limit of very long time scales and even distribution of radioactive contaminants in the environment (unfortunately, along with millions of deaths), dose would be an excellent proxy for the variables which really determine the health outcomes for human beings. However, we don’t live in the long term, and radioactive contaminants are locally concentrated rather than globally dispersed. So the model doesn’t fit the real-world situation well.
On the other hand, dose works quite well to determine deaths and illness from high exposure levels – which was the primary concern of the original workers in the field. This brings us around to the second assumption.
The line in the figure above is extrapolated downward from high doses, where it agrees well with empirical data, to low doses, where it is very hard to get empirical data. The BEIR VII report explains well why this is so:
One challenge to understanding the health effects of radiation is that there is no general property that makes the effects of man-made radiation different from those of naturally occurring radiation. Still another difficulty is that of distinguishing cancers that occur because of radiation exposure from cancers that occur due to other causes. These facts are just some of the many that make it difficult to characterize the effects of ionizing radiation at low levels.
In any event, the graph below gives an idea of the conceptual framework behind the low-dose model. The figure makes it quite clear, I think, that there is no empirical evidence anchoring our belief about the existence or absence of low-dose health effects. (The only empirical data on the graph are the four points at high doses along Curve “A”.) The idea that lower absorbed doses must correlate to reduced adverse health effects therefore represents the second assumption underlying the LNT model.
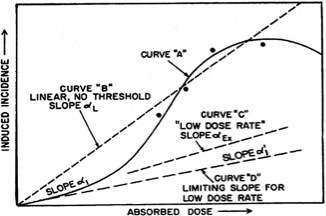
The idea that we can simply extrapolate acute dose effects down to low doses is a very significant assumption. It certainly merits at least a cursory examination – which is what the BEIR VII report gives it:
Why Has the Committee Not Accepted the View That Low Doses Are Substantially More Harmful Than Estimated by the Linear No-Threshold Model?Some of the materials the committee reviewed included arguments that low doses of radiation are more harmful than a LNT model of effects would suggest. The BEIR VII committee has concluded that radiation health effects research, taken as a whole, does not support this view. In essence, the committee concludes that the higher the dose, the greater is the risk; the lower the dose, the lower is the likelihood of harm to human health. There are several intuitive ways to think about the reasons for this conclusion. First, any single track of ionizing radiation has the potential to cause cellular damage. However, if only one ionizing particle passes through a cell’s DNA, the chances of damage to the cell’s DNA are proportionately lower than if there are 10, 100, or 1000 such ionizing particles passing through it. There is no reason to expect a greater effect at lower doses from the physical interaction of the radiation with the cell’s DNA. [underlining mine]
This explanation sounds so obvious that it’s actually hard to open up your mind and question it. However, it is seriously, seriously flawed, and for an interesting reason. The BEIR VII explanation is wrong, in part, because cells can repair themselves – or “choose” not to. Therefore, while chromosomal damage does follow a linear dose dependence - as described - there are cellular feedbacks resulting from that damage which are highly non-linear with respect to dose. (Non-science translation: irradiated cells can respond in ways which are not strictly proportional to the dose.)
This conclusion is very surprising, since we’re encouraged to consider the idea that cells can repair radiation damage as evidence that low levels of radiation are not a significant danger. I do not think that this is necessarily true. The cell is a complex, rather autonomous entity; for instance, we understand that it is possible for the cellular machinery to run amok. (Our word for this situation is “cancer”.) Cellular regulatory mechanisms, when confronted with radiation damage, face at least two options:
1. If the damage is severe, the cell can undergo programmed cell death (apoptosis). In this case, the cell is disassembled, with the waste products absorbed by neighboring cells.
2. If the damage is less severe, the cell can attempt to repair the chromosomal injury caused by ionizing radiation. Because DNA is a very complicated molecule and nature is messy, however, sometimes this repair process will result in genetic mutation and cancer.
Note carefully: since the cells with less damage are more likely to undergo self-repair, it’s plausible that lower doses might correspond with a higher cancer risk. Oh.
In case you like to skip to the end, and you arrived at this point the quick way, you can read this next paragraph and be just as smart as everybody who read straight through. Harvey Wasserman gets it right in his Buzzflash article, “Safe” Radiation is a Lethal Lie:
Science has never found such a "safe" threshold, and never will.
It’s an interesting question to think about how, over time, the justifying assumptions supporting the LNT model have been internalized by the scientific community, until we reach the point where they’re not only no longer questioned, they’re scarcely recognized. Unfortunately, the results for the rest of us are - quite frankly - terrifying.
— Aaron Datesman
April 03, 2011
George Monbiot, Holocaust Denier
By: Aaron Datesman
I think it was this article from Common Dreams, on the 30th anniversary of the accident at Three Mile Island, which first activated my interest in TMI. Although my negative opinions about nuclear power began to emerge in late 2005, at the end of my short career in the nuclear industry, until the spring of 2009 they had built up only slowly. Before then, it had never occurred to me to utilize my own scientific training to evaluate what I knew about the accident which had taken place so nearby to my childhood home.
Argonne National Laboratory, where I was working in 2009, is a funny place for anti-nuclear opinions to take hold. The Laboratory began its existence as the Metallurgical Laboratory of the University of Chicago, which was an important part of the Manhattan Project. Even today, Nuclear Engineering remains the largest research division at the Laboratory. So it probably would have been an easy place to go along to get along – except that my colleagues in the research group in which I worked came from Ukraine.
I remember vividly a day in April, 2009, driving on site with my two friends. I was sitting in the back seat and, since I’d been reading about Three Mile Island, I thought to ask what their experience of the Chernobyl disaster had been. The pain in that small space in that car was like a child had died. “A very terrible time,” my friend said.
I thought of this when I listened to the exchange between Dr. Helen Caldicott and George Monbiot broadcast on Democracy Now! It’s a truly remarkable display of douchebaggery on Monbiot’s part; it’s especially cute that he tries to smear Caldicott for behaving like a climate change skeptic. But I think these two statements pulled from their exchange capture the essential point:
HELEN CALDICOTT: Oh, Amy, the whole thing’s nuclear madness, which is what I called my first book that I wrote in 1978. A new report from the New York Academy of Sciences has just translated 5,000 papers from Russian into English. It’s the most devastating report I’ve ever seen. Up to a million people have already died from Chernobyl, and people will continue to die from cancer for virtually the rest of time.
GEORGE MONBIOT:—that so far the death toll from Chernobyl amongst both workers and local people is 43.
George Monbiot accusing Helen Caldicott of ignoring the scientific consensus (because he read an IAEA report!) is utterly unsupported and ridiculous. What’s the real story here? I think the real story here is that George Monbiot is acting like a Holocaust denier.
— Aaron Datesman


